
The
numerous natural products and their bioactivity potentially afford an
extraordinary resource for new drug discovery and have been employed in cancer
treatment. However, the underlying pharmacological mechanisms of most natural
anticancer compounds remain elusive, which has become one of the major
obstacles in developing novel effective anticancer agents. In this case, we developed
CancerHSP which could be used to address these unmet needs. Here, a case study of
taxol is provided to illustrate how to use CancerHSP.
Part
1. Data collection
1)
Select
“Chemical name” option in the search box and use “Taxol” as a keyword for
searching;
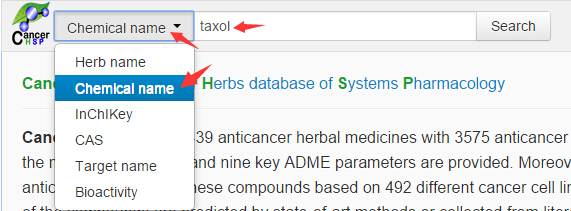
Figure 1
2)
The
browser will display the page of chemical entries which contains the
highlighted “taxol” substring in the chemical names;
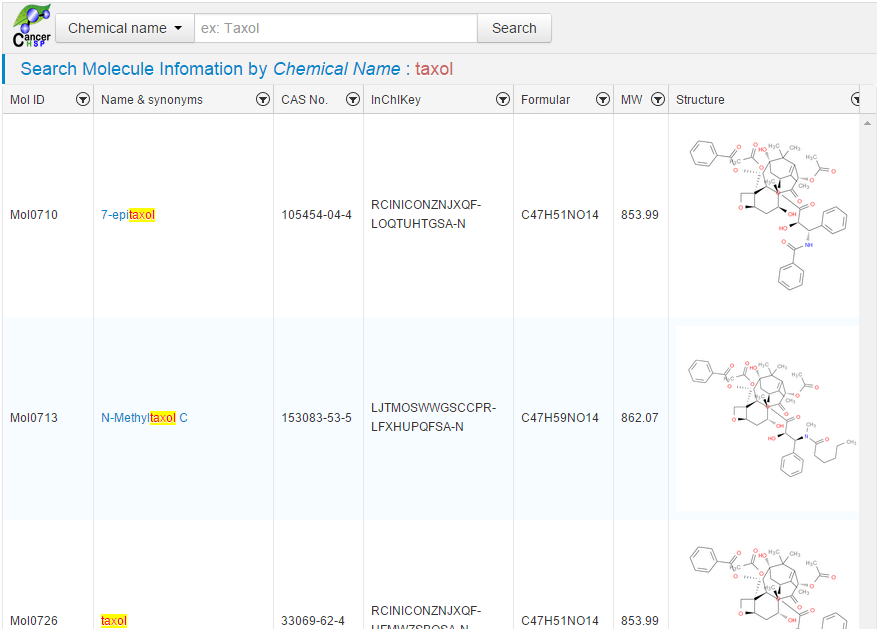
Figure 2
3)
CancerHSP
provides a very useful gadget which is a feasible way to filter and sort data,
thus user could easily find the full matched entry in this page;
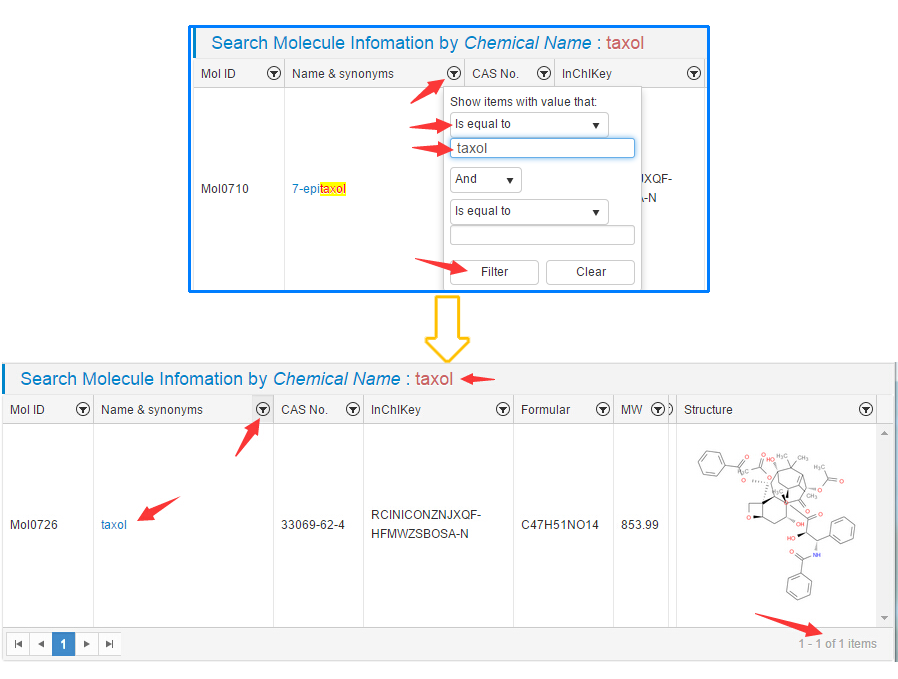
Figure 3
4)
After
clicking the “taxol” in “Name & synonyms” column, molecule information page
of taxol will be visible, where molecule structure, pharmacological and
molecular properties, anticancer activities, targets, related herbs,
references, etc., were well organized and displayed.
In this page, user could collect the ADME properties, anticancer activities
based on cancer cell lines, targets, etc.
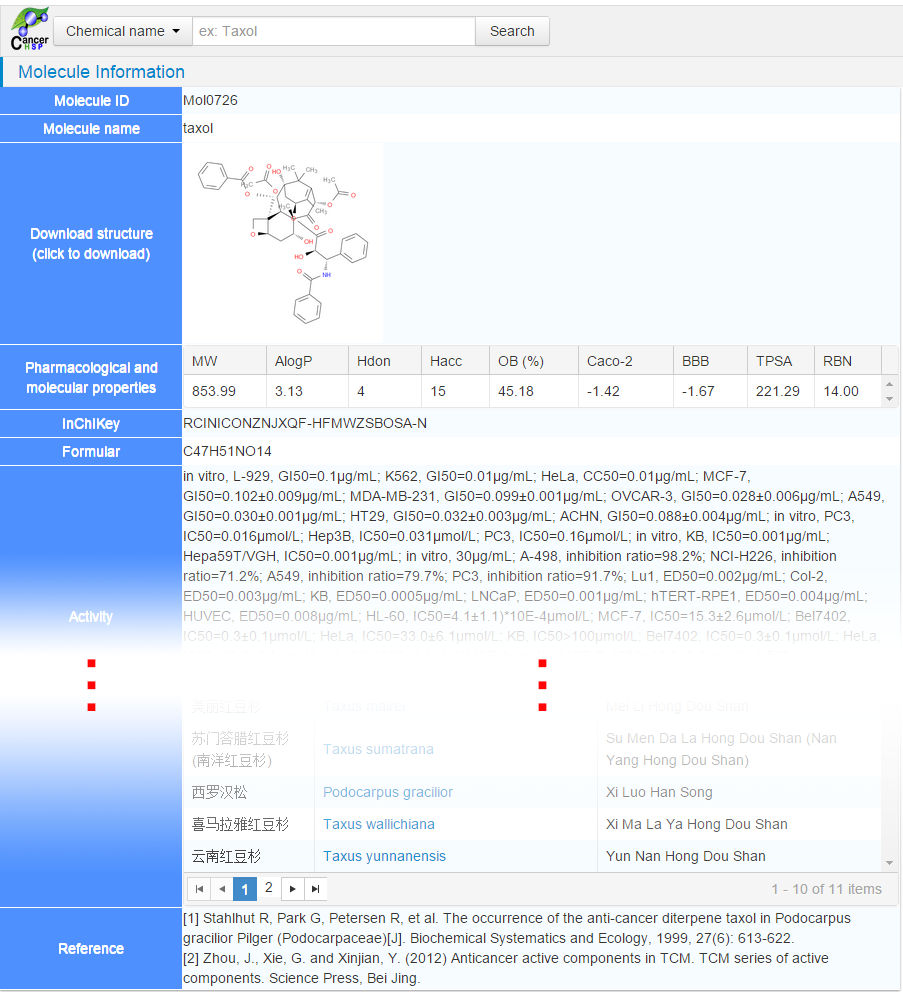
Figure 4
Part
2. Data analysis
1)
ADME
analysis
By analyzing the ADME
parameters for all compounds in CancerHSP, the basic distribution profiles show
a very interesting phenomenon (Figure 5). For example, for the molecule weight
(MW) profile of the compounds in CancerHSP, the median is 426.80, and 90% of them fall into 230.33 to 971.02
g/mol which is different from Lipinski's rule of five. This phenomenon indicates
that anticancer drugs may have a specific MW profile.
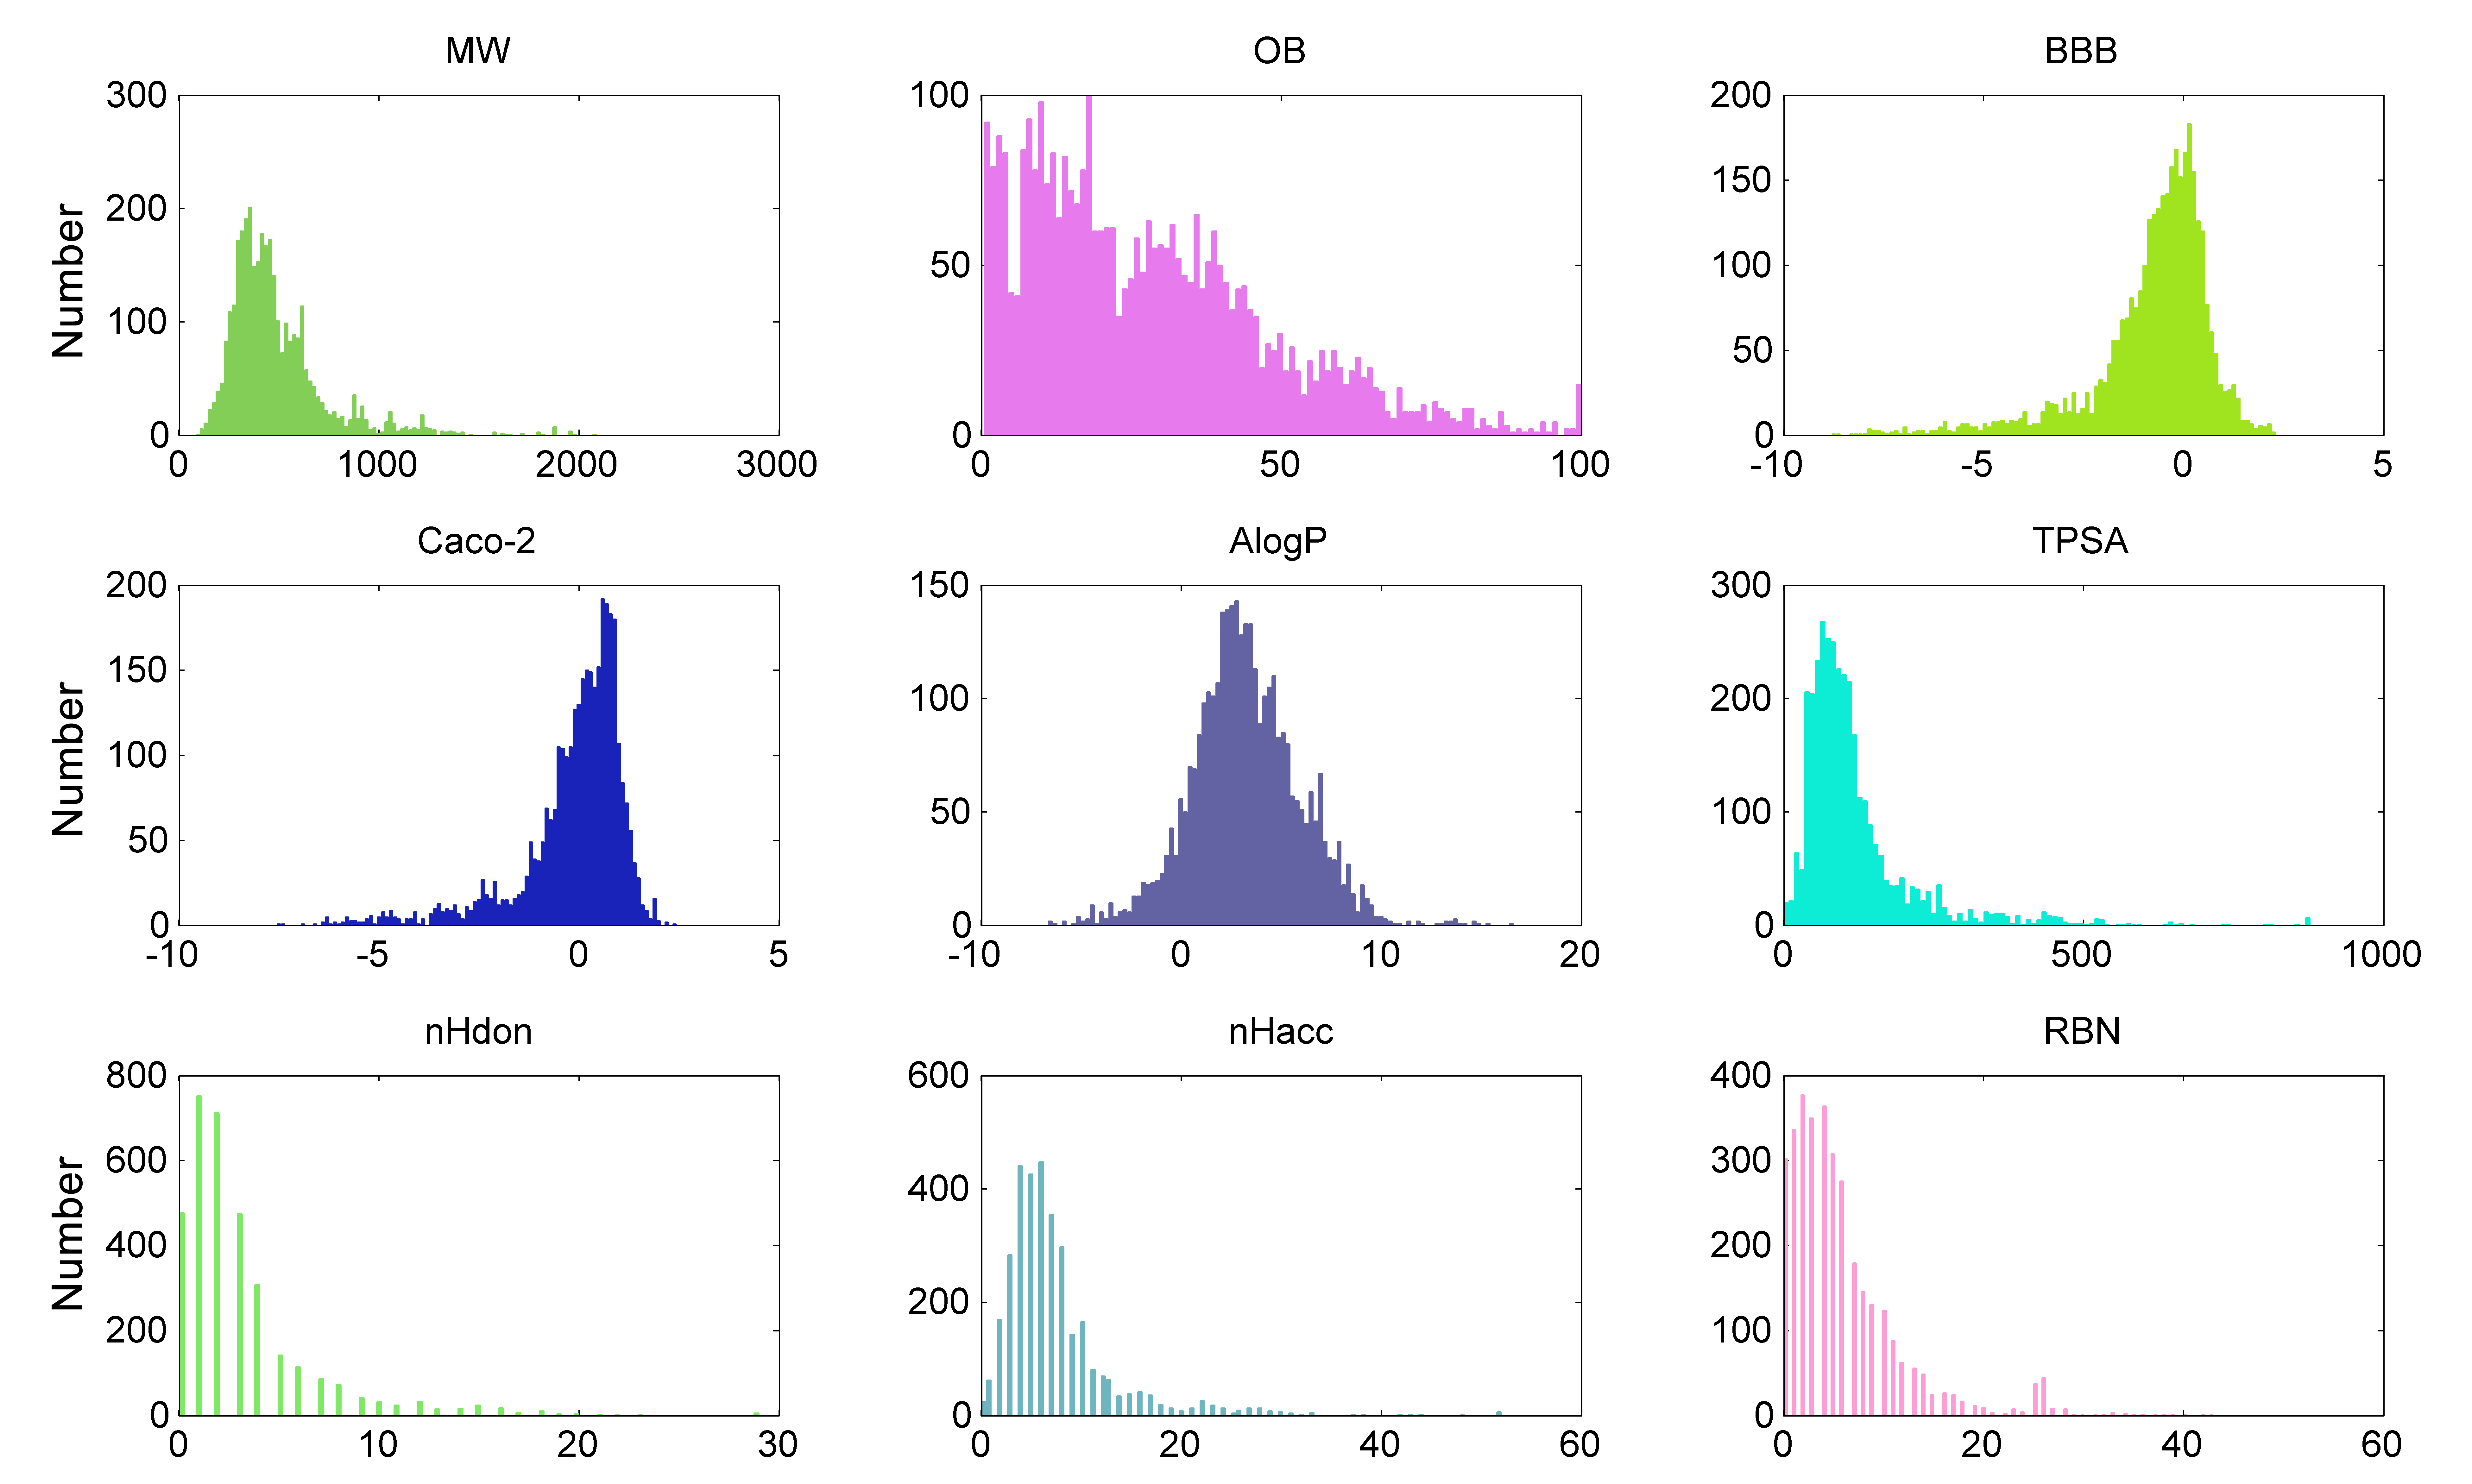
Figure
5. The distribution profiles of ADME parameters for compounds in CancerHSP
Table 1. The minimum, 5%
percentile, median, average, 95% percentile and maximum values of the
parameters for compounds in CancerHSP.
|
MW |
OB |
BBB |
Caco-2 |
AlogP |
TPSA |
nHdon |
nHacc |
RBN |
|
|
minimum |
85.12 |
0.55 |
-8.79 |
-7.55 |
-6.66 |
0.00 |
0 |
0 |
0 |
|
5% percentile |
230.33 |
2.53 |
-4.00 |
-3.05 |
-1.05 |
37.30 |
0 |
2 |
0 |
|
median |
426.80 |
24.05 |
-0.44 |
0.17 |
3.07 |
93.06 |
2 |
6 |
4 |
|
mean |
486.10 |
28.04 |
-0.79 |
-0.15 |
3.23 |
119.51 |
3.25 |
7.75 |
6.04 |
|
95% percentile |
971.02 |
66.91 |
0.90 |
1.23 |
7.80 |
317.05 |
11 |
21 |
18 |
|
maximum |
2086.62 |
100.00 |
2.30 |
2.44 |
16.60 |
877.36 |
29 |
52 |
43 |
By mapping the parameters of taxol to
whole dataset distribution, we can roughly know which parameters need to be
modified when developing a new anticancer drug.
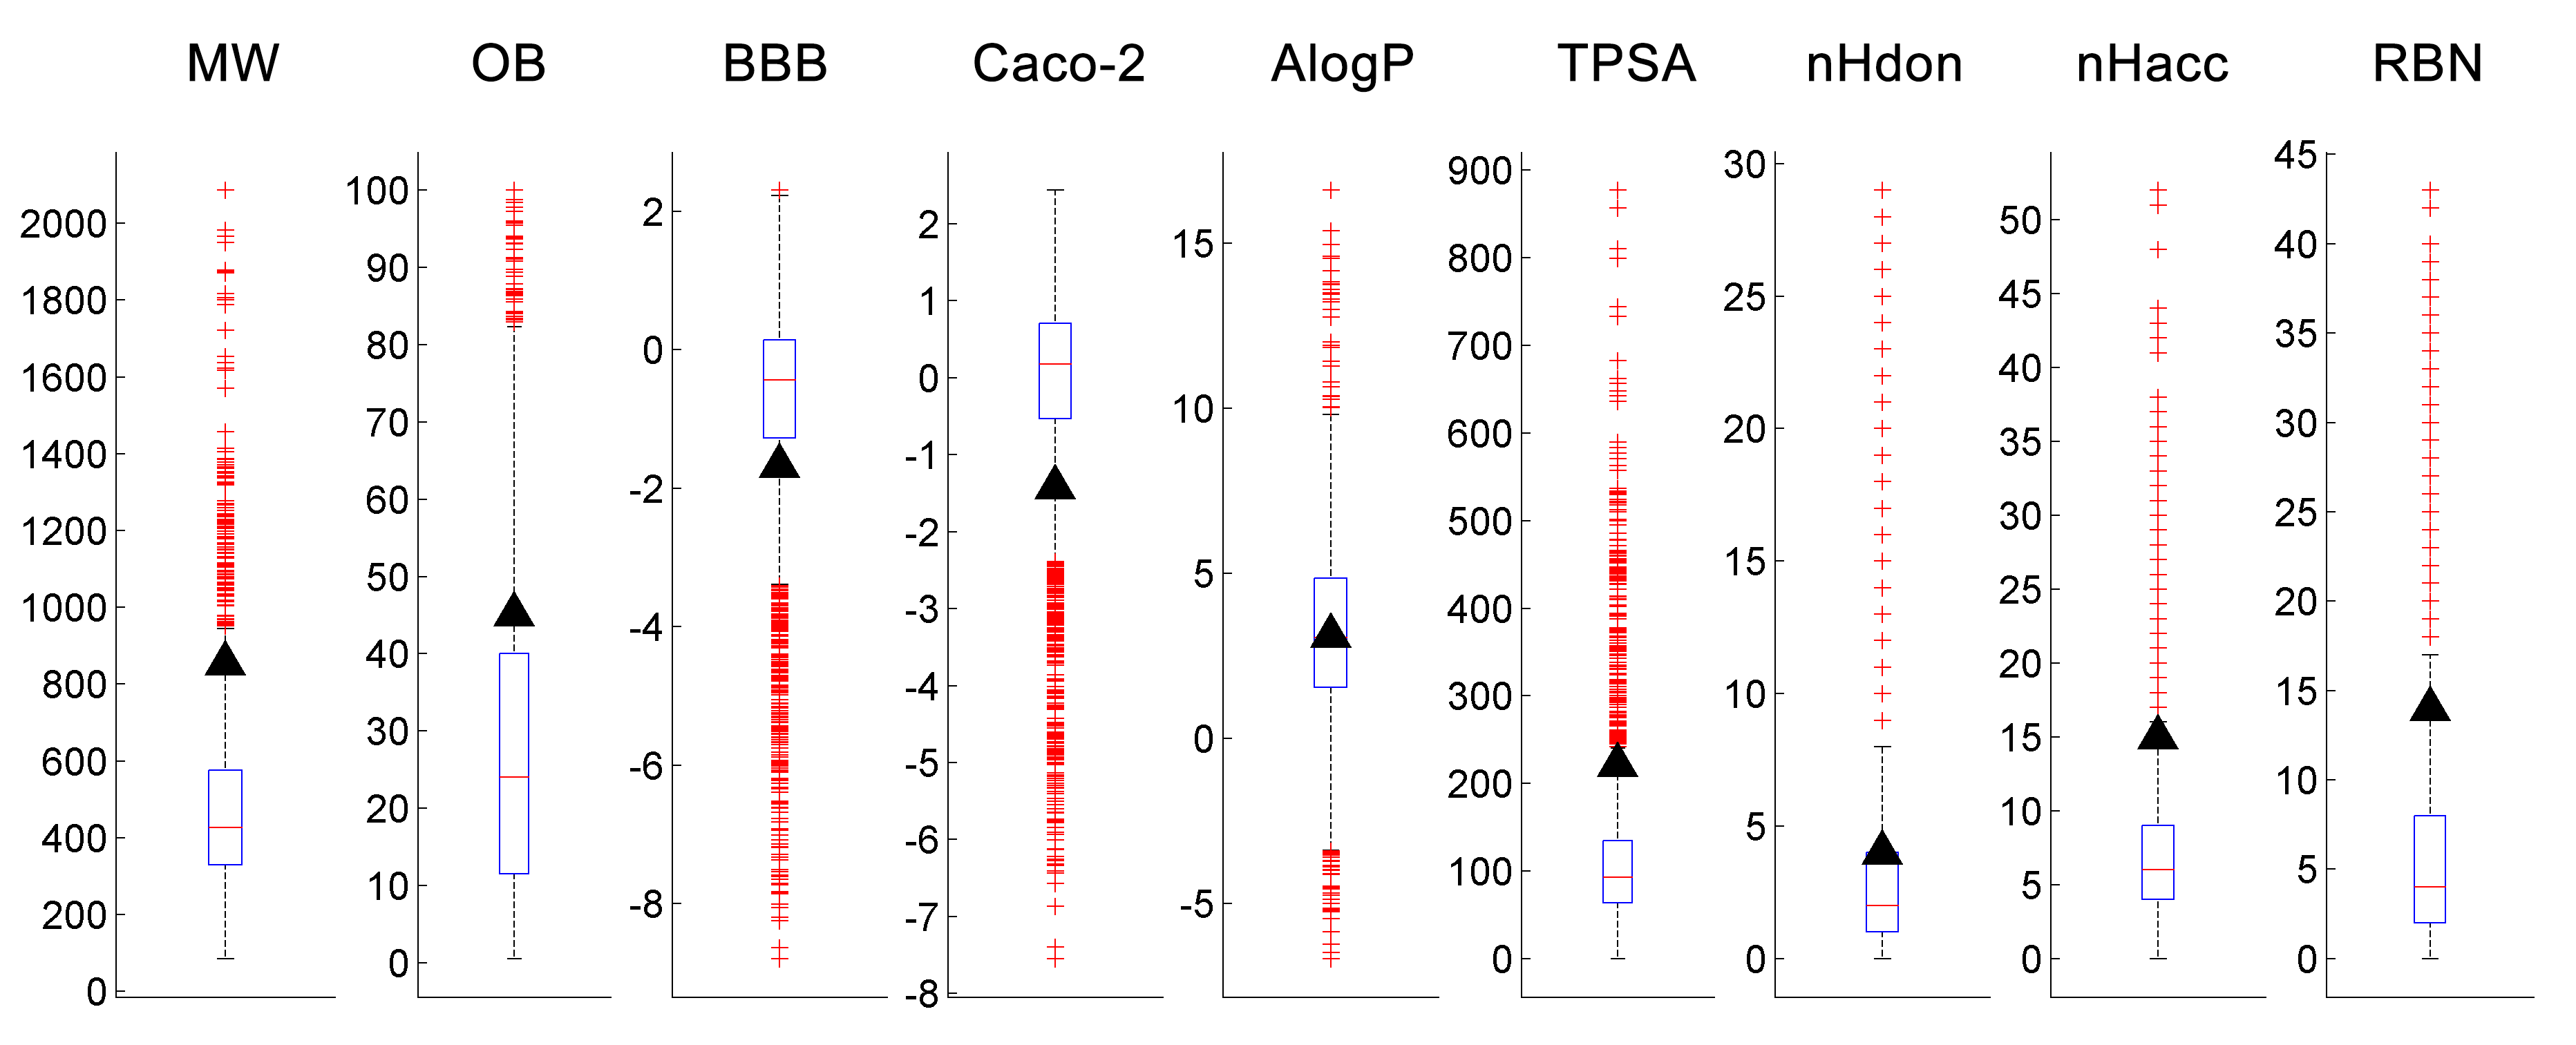
Figure 6. The box plots of parameters
for compounds in CancerHSP. The black triangles represent taxol. The red plus
signs are outliers.
2)
Sensitivity
analysis
The sensitivity data
(anticancer activity based on cell lines) in CancerHSP can be analyzed after
transforming by the following formula:
![]()
Where xi is the ith value of sensitivity data, ED50 for
example, which are unified by the units; X denotes one kind of sensitive data set, ED50
in this case, for one compound; and median
is the function of calculating the median value in X.
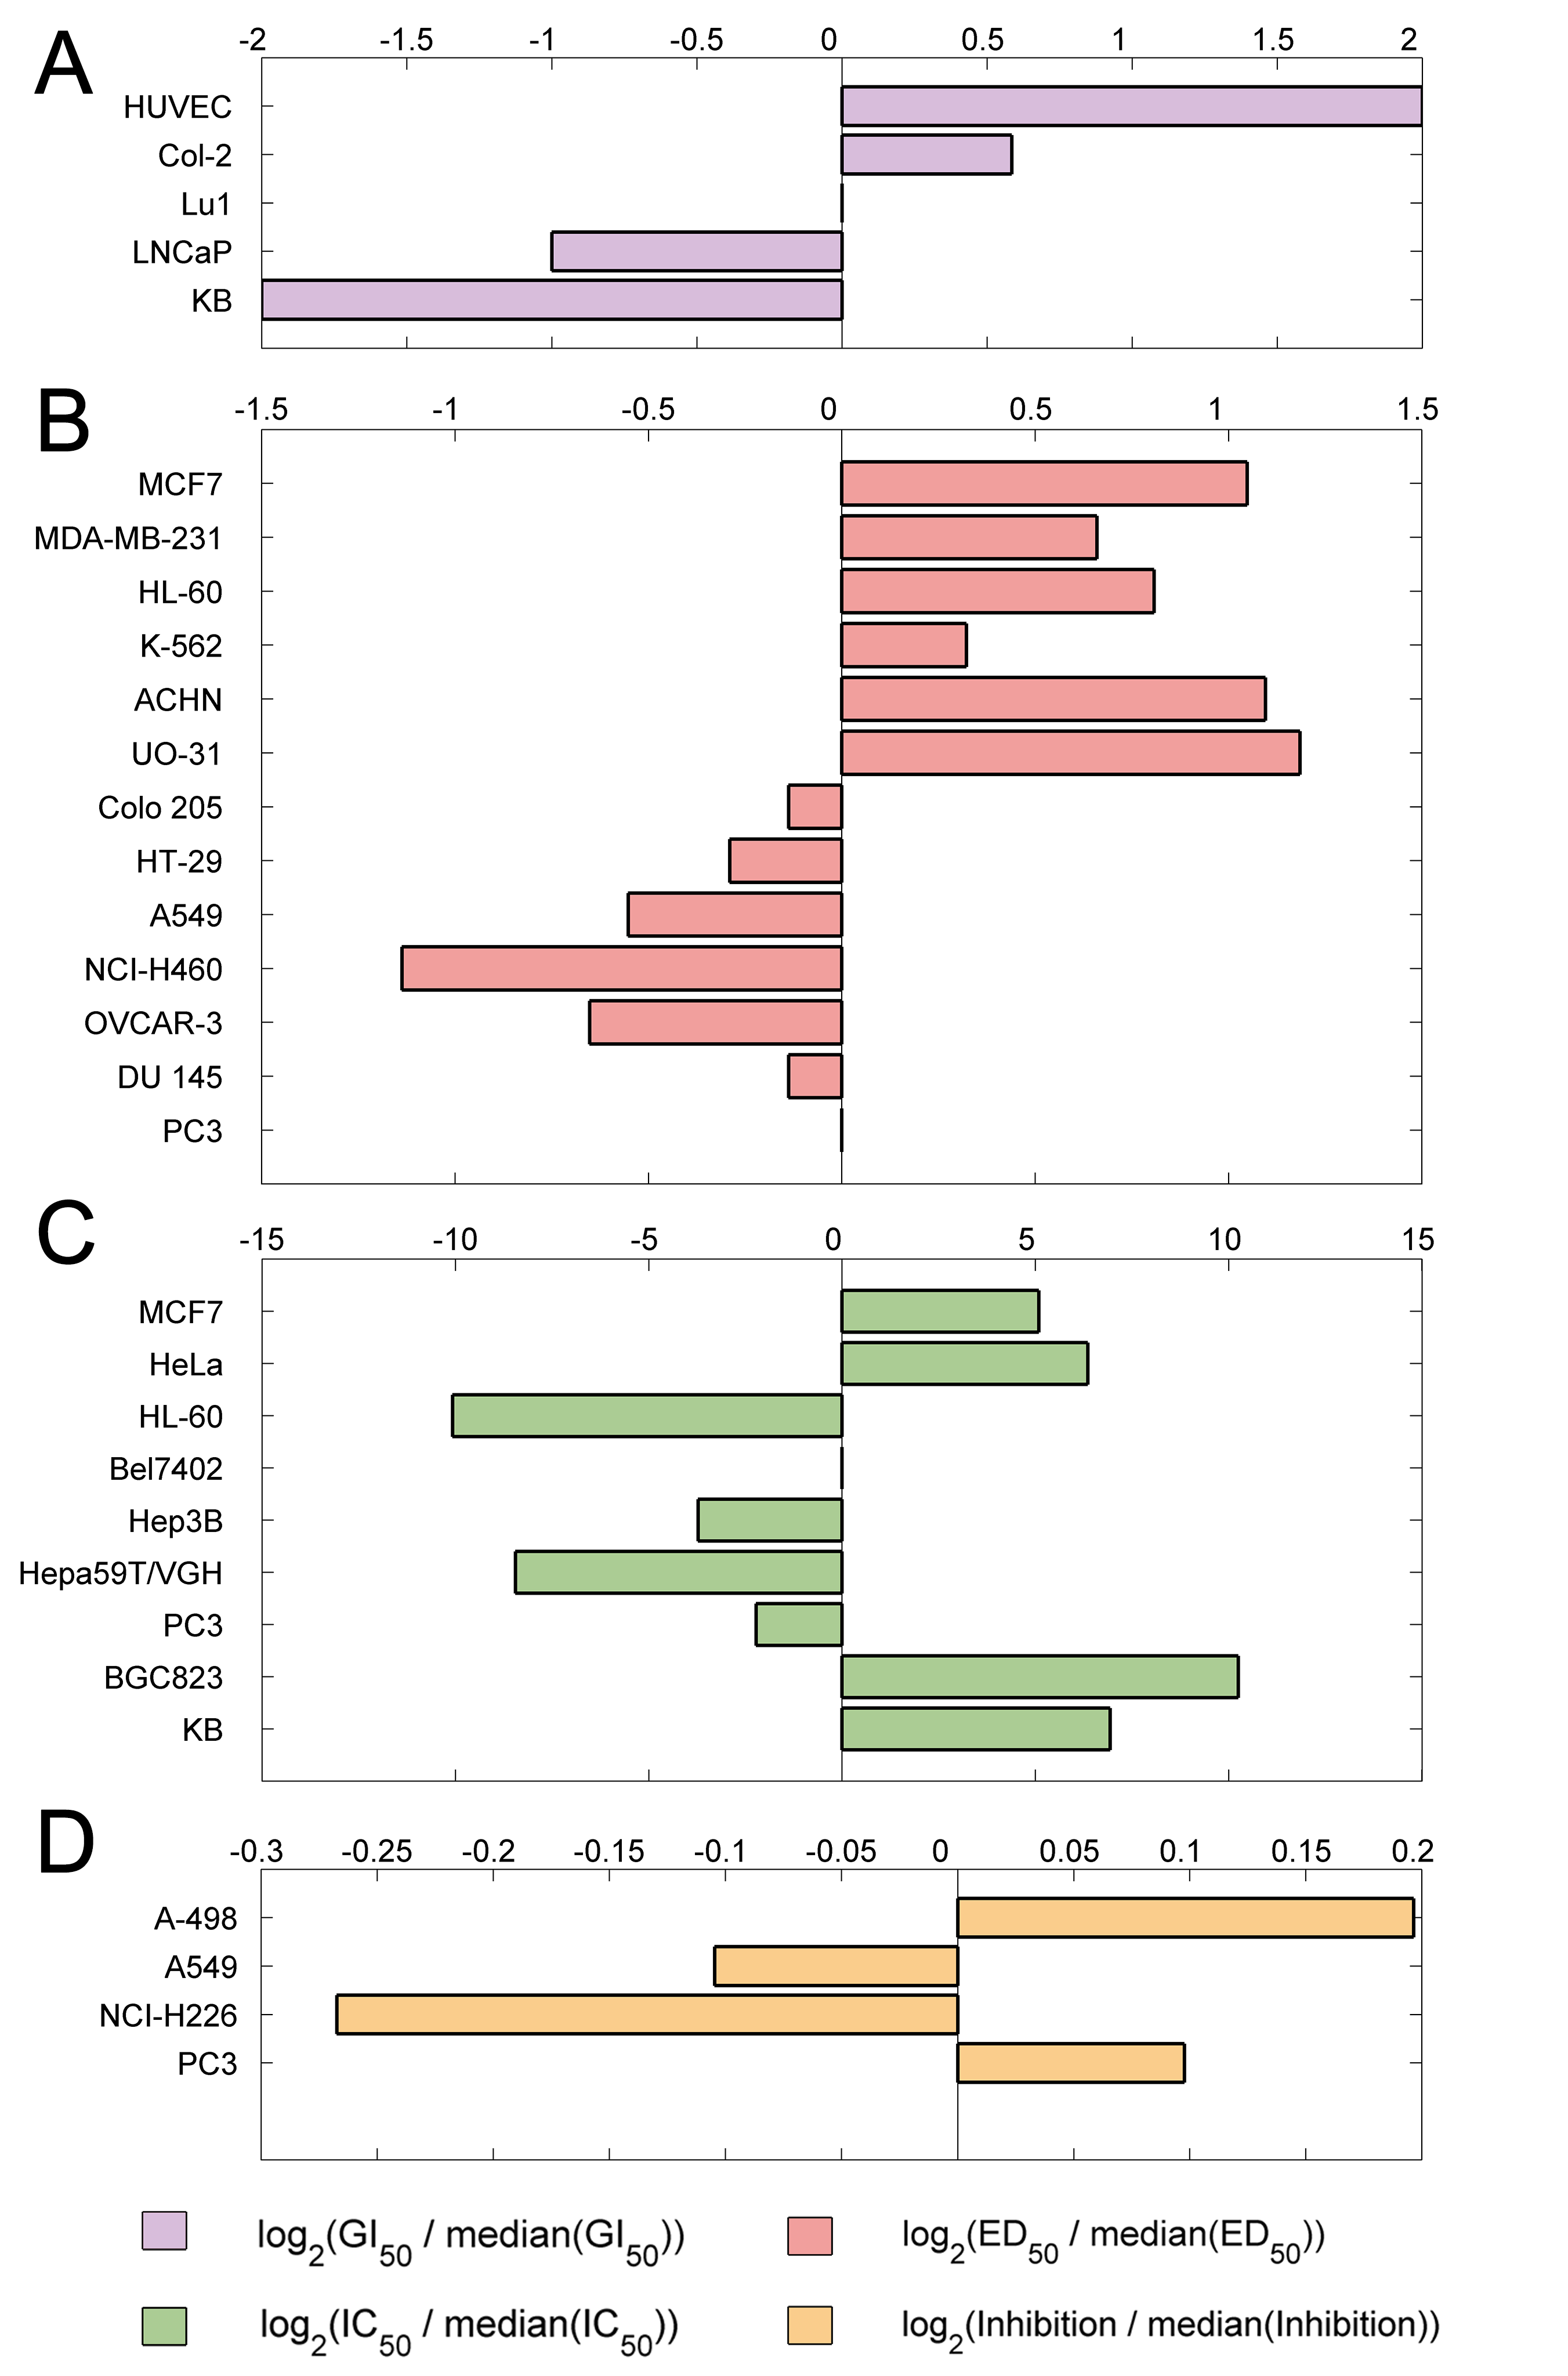
Figure 7. Sensitivity of cancer
cell lines for taxol. In figure 7ABC, generally, the cell lines with negative S
values are more sensitive than the positive ones. In contrast, the cell lines
with positive S values are more sensitive than the negative ones in the figure
7D, due to they are Inhibition rates of cell lines under the treatment of
30μg/ml taxol.
3)
Target
analysis
There
are 37 targets in CancerHSP which were predicted by our previous methods 1,2, 16 of them were proved by the literatures,
BindingDB 3 or DrugBank database 4. However, there are
also 11 targets need to be proved by the “wet” experiments. All these targets
provide clues to look inside why the taxol shows different sensitivities to a
range of cancer cell lines. In addition, the drug action mode provide more precise
drug-target interaction detail which is a new opportunity to uncover the
mechanisms when using network methods 5. By analyzing the ontology 6,7
and pathway 8,7 which these protein targets involved, the relationships
between these protein to biological process, molecular function and cellular
component will be emerging.
Part
3. Other usages
1)
The
anticancer chemicals in CancerHSP can be used as the lead compounds for
developing anticancer drugs.
2)
The
compound structures can be download for further study by building statistical
models.
3)
It
is also valuable for searching anticancer compounds in traditional Chinese
medicines.
References
1
Yu, H. et al. A systematic prediction of multiple drug-target interactions from
chemical, genomic, and pharmacological data. PLoS One 7, e37608 (2012).
2
Zheng, C. et al. Large-scale direct targeting for drug repositioning and
discovery. Submitted (2014).
3
http://www.bindingdb.org/bind/index.jsp, access time: January
16, 2014
4
http://www.drugbank.ca/, accessed on October 1st
2013
5
Zheng, C. et al. Systimg/s-pharmacology dissecting holistic medicine for
treatment of complex diseases: an example using cardio-cerebrovascular diseases
treated by TCM. Submitted (2014).
6
http://david.abcc.ncifcrf.gov/
7
http://amp.pharm.mssm.edu/Enrichr/
8
http://www.genome.jp/kegg/pathway.html